
Influenza Season Staffing Plan
This project supports medical staffing decisions during flu season
by identifying high-risk states using CDC influenza data.
A dynamic Tableau dashboard visualizes mortality patterns
and guides resource allocation.
Project Overview
This project analyzes CDC influenza death statistics alongside U.S. census population data to identify states with the highest mortality rates among adults aged 65 and older. The findings are designed to support healthcare workforce planning during peak flu seasons.
🧩 PROBLEM:
Staffing agencies must determine where and how many healthcare professionals to deploy across U.S. states in anticipation of flu-related patient surges, especially among high-risk elderly populations.
🎯 OBJECTIVE:
To perform a data-driven analysis of influenza mortality trends and geographic distribution, enabling proactive staffing strategies that ensure hospitals are adequately prepared in the most affected regions.
📊 KEY INSIGHTS:
-
📍 California and New York reported the highest flu mortality rates among seniors.
-
🕒 Mortality spikes between November–March each year.
-
📊 Elderly adults (65+) are the most affected demographic.
-
✅ States were ranked by priority: High, Medium, Low Need.
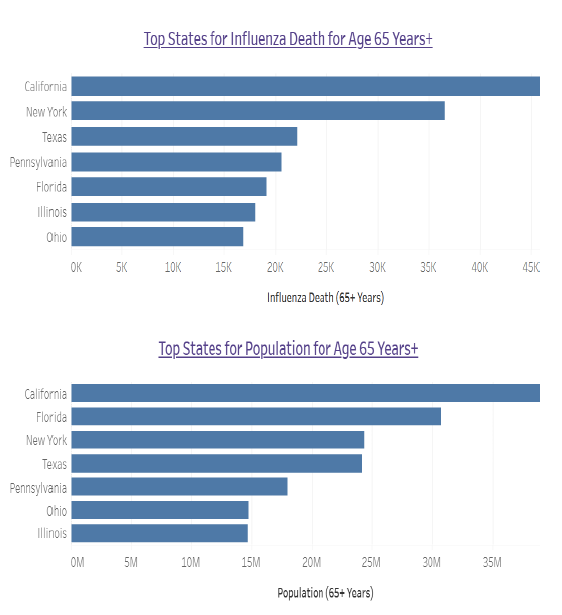
Tableau dashboard displaying influenza-related deaths by U.S. state (Adults 65+).

🧪 Research Hypothesis
If a state has a higher proportion of persons aged 65 and up, then such a state will have a higher influenza-related death rate.
1. California Leads in Both Deaths and Population
California has the highest number of influenza-related deaths and alsothe largest population of adults aged 65+, which aligns with expectations due to sheer size.
2. New York and Texas Show High Deaths, but Differing Populations
New York has a higher death count than Texas, despite Texas having a slightly larger elderly population.
🛠️ Tools & Techniques
-
Tableau for visualization
-
Excel for cleaning and merging datasets
-
CDC & U.S. Census as data sources
-
Mapping, mortality trend forecasting
🧠 Data Interpretation
Although population size varies significantly, death rate per population reveals true risk levels.
Surprisingly, some mid-sized states like Mississippi and Tennessee show steep increases in projected deaths — despite smaller populations — suggesting regional healthcare disparities.
The weak correlation between % elderly and deaths suggests external factors (e.g., vaccination access, hospital density) also play a role.
📌 Recommendations
-
Prioritize medical staffing for California, New York, and Florida.
-
Monitor medium-need states like Illinois and Texas during peak months.
-
Update dashboard yearly for seasonal flu preparedness planning.