
Instacart Market Basket Analysis
Gain insights into online grocery shopping trends with real-world Instacart data. This project uncovers how customer behavior, order timing, and product pairing influence marketing strategies and user retention — all through data-driven analysis.
Project Overview
This project analyzes over 3 million real customer orders from Instacart, one of the largest online grocery delivery services in the U.S. Using SQL, Tableau, and Excel, the analysis uncovers customer shopping habits, peak ordering times, high-reorder products, and product bundling opportunities. The goal is to help Instacart optimize marketing strategies, enhance product recommendations, and improve user retention through data-driven insights.
✅ Objective
To uncover key customer segments and frequently purchased product patterns that can inform Instacart's promotional strategies and improve customer lifetime value.
🚩 Problem Statement
Instacart wanted to better understand what products are reordered often, when customers shop, and how they differ by order frequency. Without this insight, targeted marketing and product bundling were inefficient.
🧠 Hypothesis
High reorder rates and weekend activity indicate a predictable user shopping cycle. If analyzed effectively, this can be leveraged for dynamic promotions and increased average order value.
🔍 Key Questions Explored
-
When are customers most active throughout the week?
-
What products are frequently reordered?
-
Are there identifiable customer segments based on order frequency?
-
Can we suggest bundles based on product combinations?
📊 Visuals & Insights
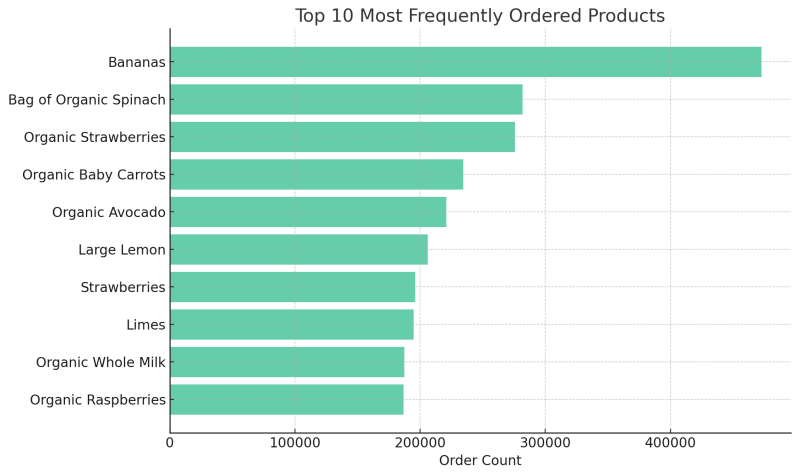
Top 10 Most Frequently Ordered Products
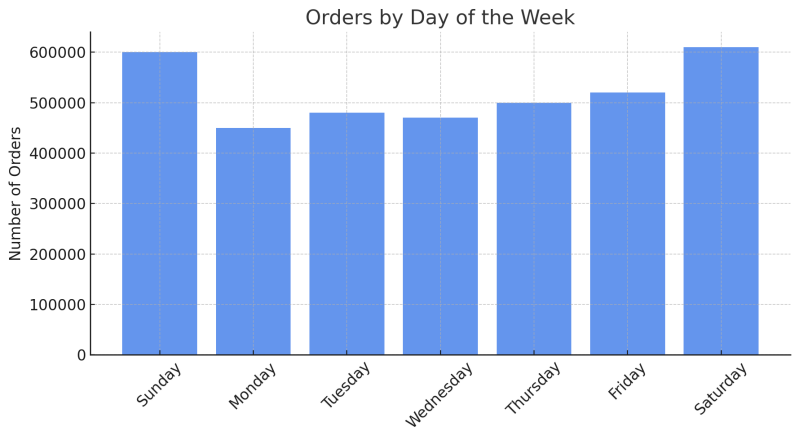
Orders by Day of the Week
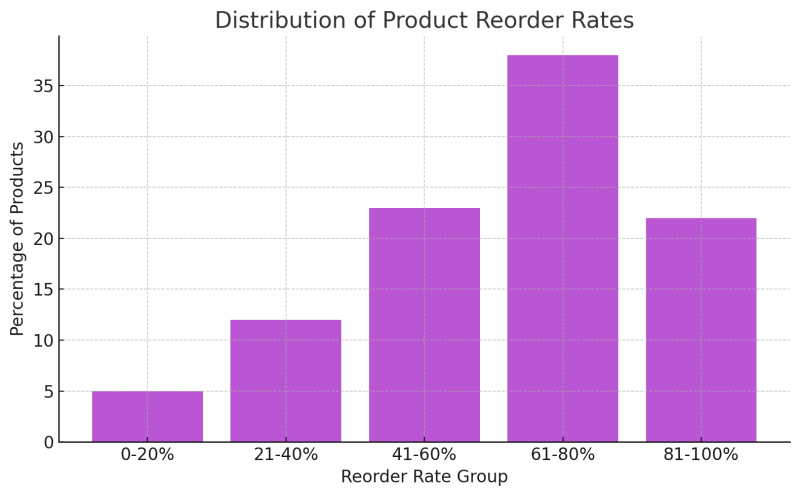
Distribution of Product Reorder Rates
💡 Recommendations
-
Time-Based Marketing: Promote weekend bundles with Thursday email triggers.
-
Product Bundling: Use frequent reorders to form suggested packs.
-
Customer Retention: Develop reward tiers for frequent users based on reorder behavior.
-
Personalized Offers: Tailor notifications by time of day and shopping history.